

Market Returns Are Never Average
By Chad Creveling, CFA and Peggy Creveling, CFA
So far 2016 has ushered in a significant bout of volatility and fear in the markets. No one likes to see their portfolio drop in value, even temporarily, but much of the angst for many investors comes from preconceived notions about investing and returns that often do not match the reality of the markets. Unfortunately, misleading assumptions about investing can cause investors to make poor decisions, abandon long-term investment strategies, and destroy significant wealth.
Expected Return Does Not Mean What You Think It Means
One of the key concepts investors confuse is the idea of "expected" or average return. This terminology is used extensively throughout the financial sector and media. Everybody has heard that stocks average 8%–10% over the long run. For many investors, then, it follows that in most years they can expect to earn 8%–10% on their portfolios. Unfortunately, this is wrong for a number of reasons:
- The return on stocks, bonds, and investor portfolios depends on inflation. Returns on financial assets are not the same when inflation is running at 0% vs. 4%.
- The 8%–10% "average" typically refers to U.S. large cap stocks. Most investor portfolios are not composed entirely of U.S. large cap stocks (and they shouldn't be). An investor invested 50% in bonds and 50% in stocks certainly cannot expect the same return as U.S. large cap stocks.
- "Expected" return does not mean the return you expect to receive in most years. This is financial terminology that means "average." As the chart from Vanguard below shows, very few years generate what investors consider to be the average.
Returns Are Almost Never Average
Annual Stock and Bond Returns (1926–2014)
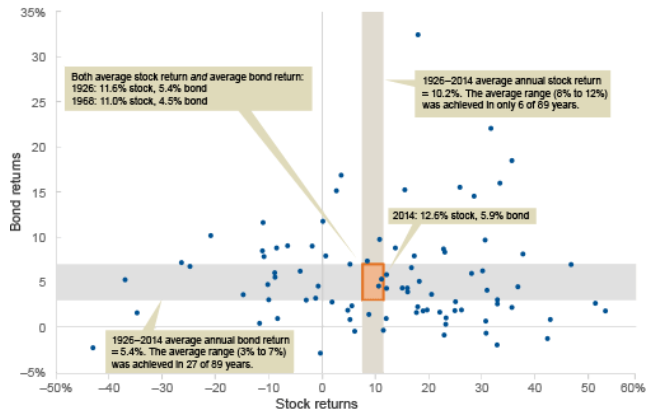
Source: "Benchmark for Success" by Don Bennyhoff, Vanguard Investment Strategy Group.
Very Few Years Produce "Average" Returns
The chart above shows the annual return for U.S. stocks and bonds from 1926 to 2014. During that period, U.S. stocks averaged 10.2% while bonds averaged 5.4%. Over the 89 years from 1926 to 2014, however, stocks and bonds rarely returned what investors would consider to be average:
- Stocks provided returns in the range of 8%–12% in only six out of 89 years.
- Bonds provided returns in the range of 3%–7% in only 27 of 89 years.
In other years, returns were all over the place—both positive and negative, exhibiting no particular pattern. Looking at the chart carefully, however, shows that in most years (about 70%), stock returns are positive as are bond returns. While the ride is not smooth, it is the preponderance of positive returns that when averaged together produce the long-run averages.
Returns Do Not Occur Smoothly
It's easy to get lulled into the idea that the markets are like a conveyor belt tilted perpetually at an 8%–10% angle. It doesn't matter when you get on the conveyor belt; there may be some wobbles along the way, but after a brief time the markets continue their inexorable 8%–10% climb. Unfortunately, this imagery is far from reality. As the chart shows, the actual return you get in any particular year is widely scattered and unpredictable. It is only after investing over many years and enduring the widely disparate annual returns that you can calculate an average.
While this may not be comforting, a greater alignment of investor expectations with reality can help relieve some of the frustration and fear for investors and help them avoid making emotionally charged decisions that can turn a short-term paper "loss" into permanent wealth destruction.